Adventures in upgrading to Ruby 3.2
As Ruby 3.3 is about to be released, I thought I’d write about our recent experience upgrading from Ruby 3.1 to 3.2 - it’s now or never!
Code profiling … survivorship bias … optimize inherited code
We have a worker that enriches an incoming stream of jobs. The volume is large enough that, even though we frequently clear the queue, our histogram of processed jobs is still quite flat.
For a major release, where we brace ourselves for a potential degraded performance, we roll out the change to a small fraction of the workers(canary) and let them run alongside the master branch. When the metrics check out and the exceptions logger is quiet, we declare that the change is good and merge it into master.
This time we were upgrading our Ruby version from 3.1 to 3.2, to enable YJIT, expecting our workers to be faster. So we decided to do canary rollout as well, so we could see from the charts how much Ruby 3.2 canary workers are better. Canary cluster running Ruby 3.2 was rolled out, and *drumrolls* … it was slower!

Prod: Ruby3.1 > Ruby3.2 YJIT
Luckily it wasn’t anything crazy, exception for some hours where canary tanked. Though it wasn’t the results we were hoping for, the increase in process times weren’t bad enough to block the whole epic, so we decided to roll it out to master, and carry on the upgrade in other projects, then make a ticket to circle back to dig deeper into this at the end of the epic. We often take up such short-term tech debt, and promise to pay it back soon while we still have the context still fresh in our heads.
About four weeks later, we finally came back to it. (After some team members returned from leave too).
We concluded from our existing metrics that only one worker step that degraded in performance: the piece that queries Mongo and evaluate the returned results to find the best match. The evaluation of the query result was done in Ruby, rather than included in the query to Mongo because it was a heuristic-based algorithm.
We found that our Resque workers that should be forking only once every 100 jobs was reverted to not only forking every job, but exiting every job. That meant we did not have much time for JIT optimizer to do its warm up and magic at all. That was fixed fairly easily by removing the conflicting gem “resque-multi-job-forks”. Now each tasks stayed online for much longer. However it still didn’t address the increased processing times.
Prod: Ruby3.1 > Ruby3.2 YJIT LongRunningProcess
I reached for “code profiling”, because now we are trying to compare 2 different code, and peek into the differences that makes canary so much slower. After failing to integrate Datadog Continuous Profiling, I went back to ad hoc profiling (running a small profiling script that wraps a suspected snippet), this time using stackprof and the accompanying flamegraph viewer stackprof-webnav (complete with a minimap!). I did this on an EC2 box that had access to Mongo, but not the ECS containers where the production workers were running (this will be important later.)
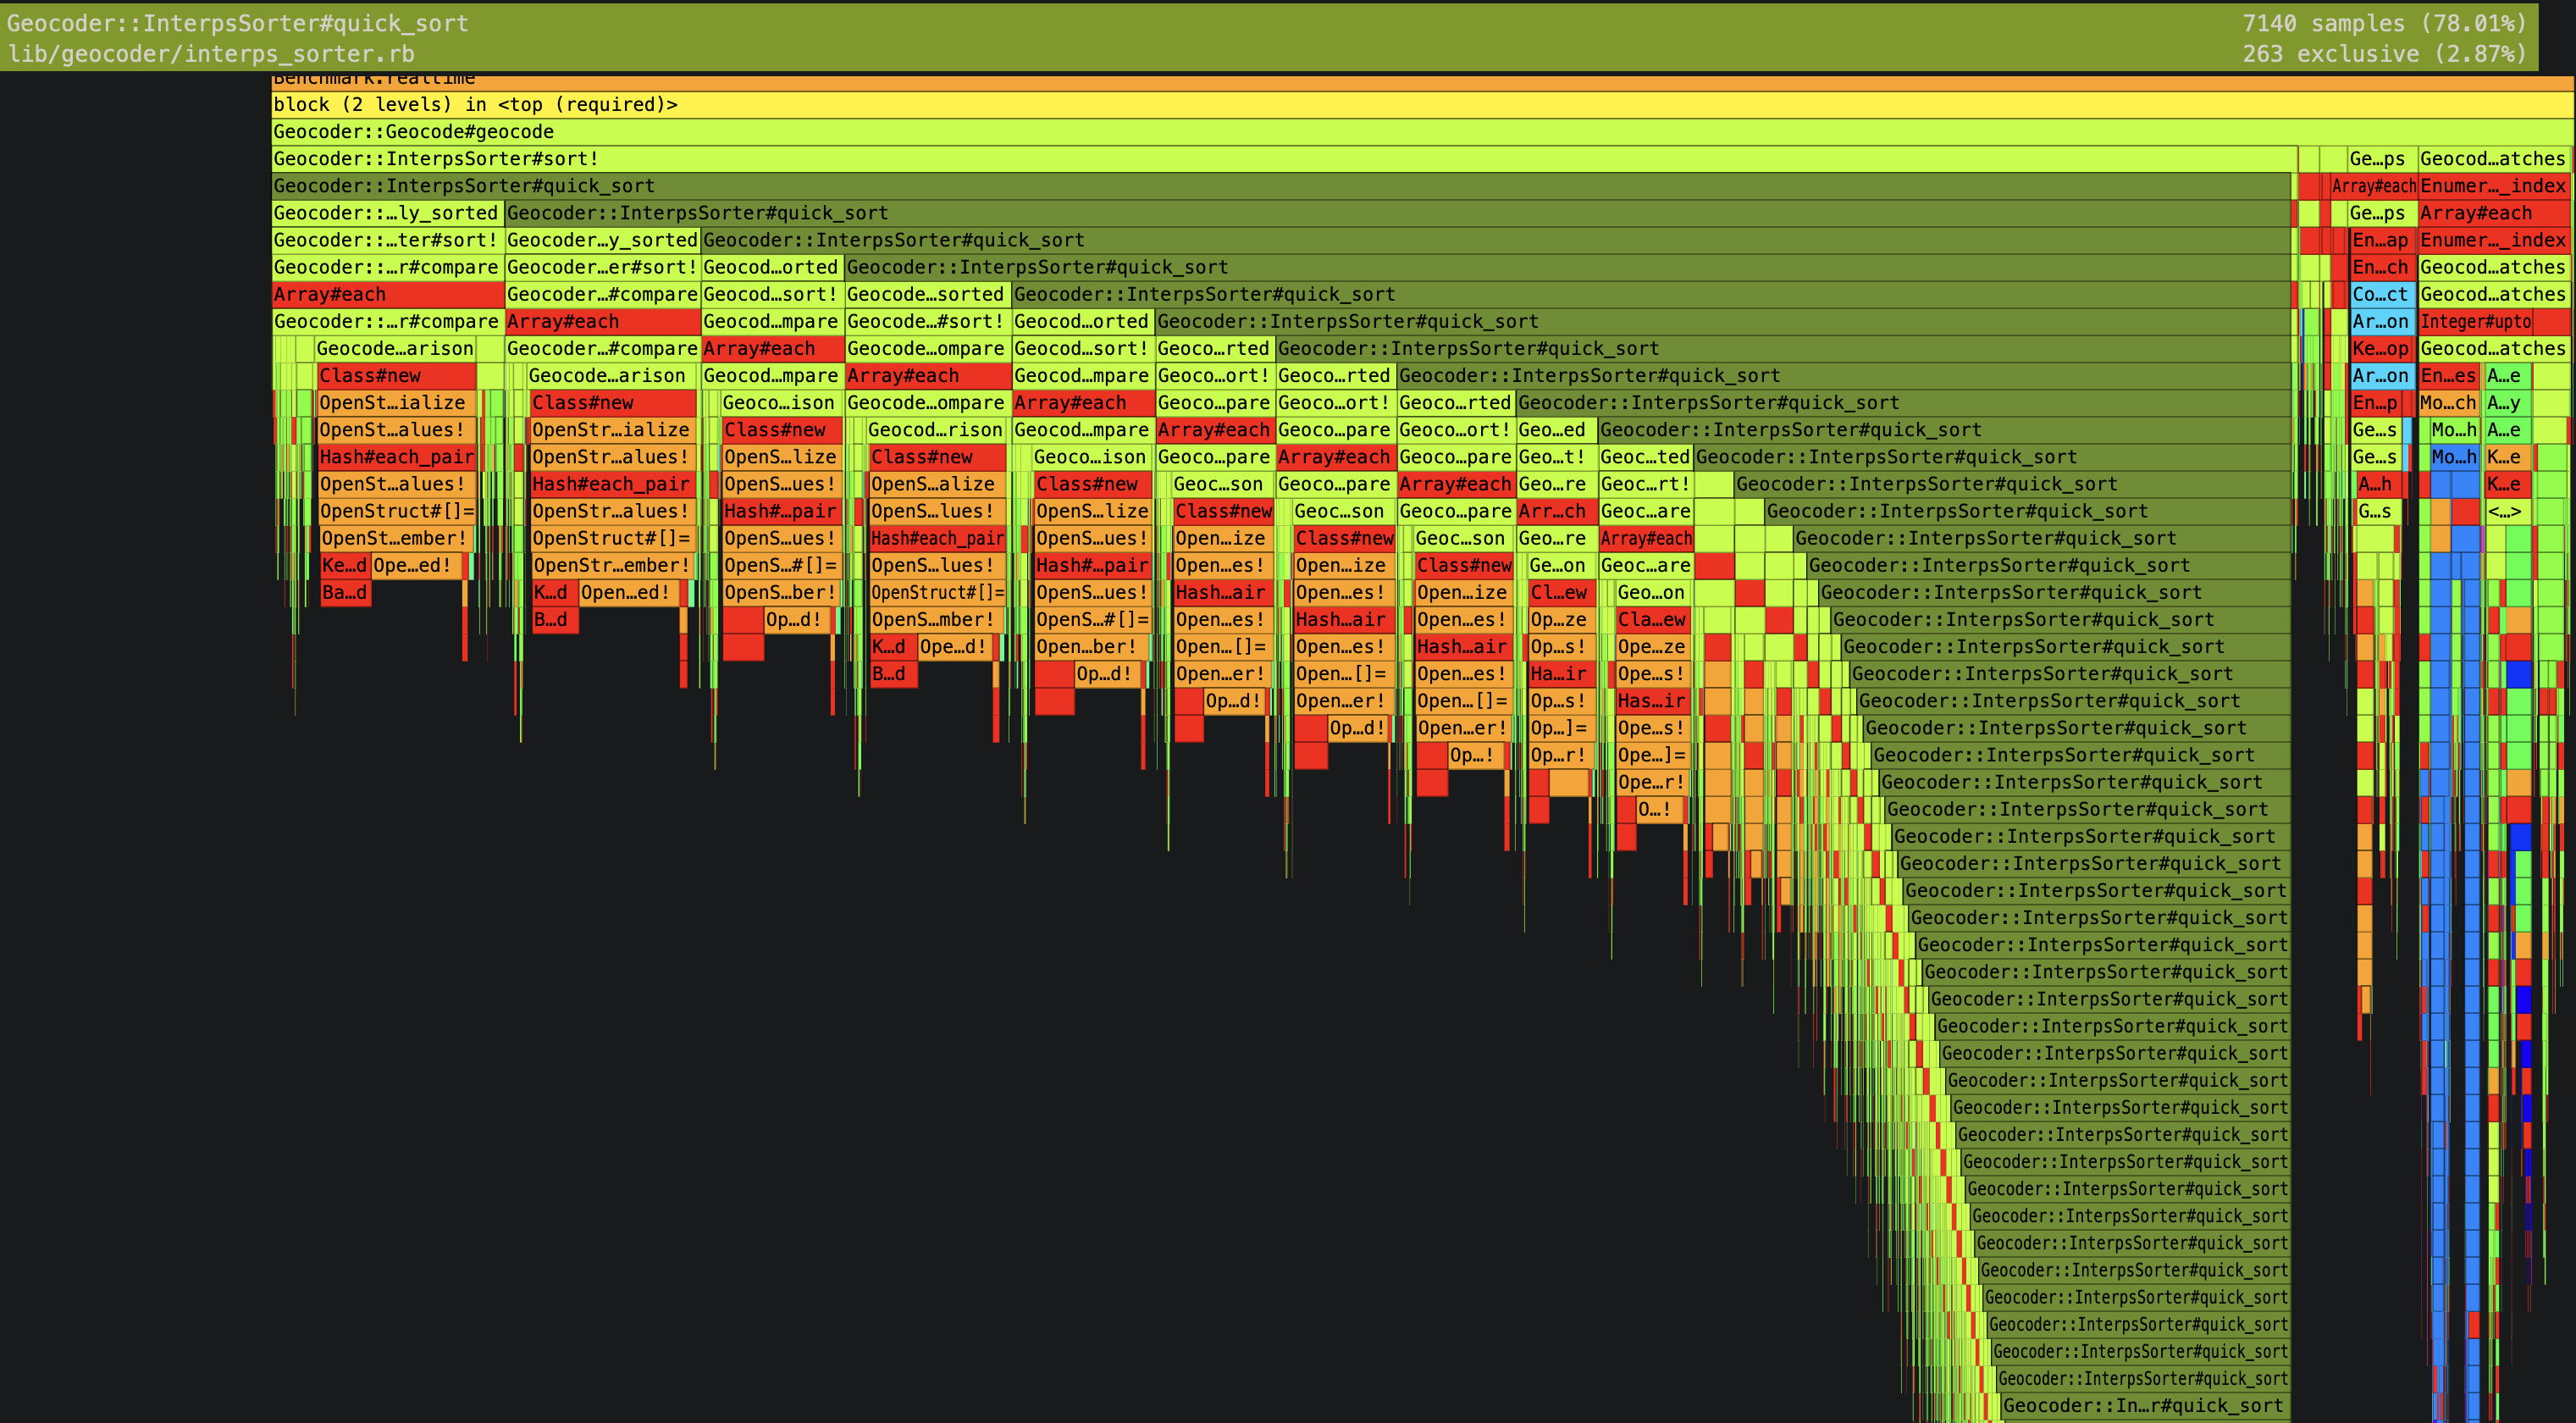
Found the culprit! It was OpenStruct (probably not clear from the static screenshot above though.) There were too many instantiations in the recursive quick_sort, and each OpenStruct initialization was quite slow.
Well, besides YJIT, the other interesting addition in Ruby 3.2 was the Data class; perfect time to refactor! Profiled code snippet proved that our fix works, we improved the performance by about 66%!
Profiling: Ruby3.2 YJIT DataClass > Ruby3.1 > Ruby3.2 YJIT
Apparently, JIT push OpenStruct from bad to worse.
As a bonus, after this refactor to change OpenStruct into Data class is done, we realized that these instances of immutable data were only needed when we want diagnostics data for this worker step. Actually we don’t even need to log these stuff all the time. Treating these data as diagnostics data, we guard them behind a flag, thus bypassing the expensive operation altogether. After this change, the profiled code performed slightly faster than the original Ruby 3.1 code. Phew!
Profiling: Ruby3.2 YJIT SkipDiagnostics > Ruby3.1 > Ruby3.2 YJIT
We rolled out this change to a new canary. I eagerly monitored the next hour* of charts. Lo and behold, the metrics shows the average of the 95-percentile process time as… *drumrolls* … even slower now?!
Prod (from 1 hour stats): Ruby3.1 > Ruby3.2 YJIT > Ruby3.2 YJIT SkipDiagnostics
After more logs analysis, and we found the raw input value when the problematic step took too long. (Specifically, geocoding some US raw locations is slow because there were many similar candidates to sort through.) I ran the ad hoc profiling code again on the poisonous raw value, and indeed it took so very long on Ruby 3.2, even with the fix, even back in ruby 3.1. All 3 cases took more than 90s, but at least they still agreed with the earlier numbers:
Profiling: Ruby3.2 YJIT SkipDiagnostics > Ruby3.1 > Ruby3.2 YJIT
Profiled code behave differently from production code 🤔.
Maybe we didn’t JIT enough? I considered switching to TruffleRuby for the ultimate JIT’ing. I almost threw in the tower here and decided to go to sleep.
The next morning, I tried the ad hoc script on the production container itself:
- On Ruby 3.2 with the diagnostics skipping fix, it finished in 90s.
- On Ruby 3.2 before the fix, the profiling script got killed.
- On Ruby 3.1, the script again got killed.

ECS was killing the jobs that ran out of memory. 🤦 This is a case of Survivorship bias blinding us from the really slow jobs. They were so bad that the container were just killed and didn’t even send the timing metric.
And the fix was enough of an improvement that we were able to complete those paralyzing jobs, such that larger timing values were sent in and worsening the 95-percentile process time.
This hypothesis was supported by the fact that after we rolled the fix out to master, the aggregated metrics did improve, and now the worker is indeed slightly faster than what it was before the ruby upgrade, just as predicted by the ad hoc profiling exercise. The canary worker were just unlucky and picked up the poisonous data in the hour that I was monitoring.
Prod (before/after): Ruby3.2 YJIT SkipDiagnostics > Ruby3.1 > Ruby3.2 YJIT

Conclusion
- So in the end JIT didn’t do much for us,
- but understanding the code we inherited and optimizing them was the answer. Git gud!
- Profiling saves the day again!
- We need better observability:
- Hunting down the slowest steps in the worker using Datadog should be more systematic
- We should start monitoring how our ECS tasks exit
- We need better canary process/guideline:
- test the canary changes in production for longer, until the law of large numbers kicks in,
- or do a direct comparison on a golden test set.